Trading with Woodies CCI Patterns
This Woodie CCI indicator belongs to the oscillators class, it was created by Donald Lambert in the 80s of the last century.
Before reading the article and writing your questions in the comments section, I recommend to watch this video. It’s not long but covers the biggest part of questions on the topic.
The creator believed that the CCI indicator will help to accurately determine the turning points in the financial markets. Many traders believe this indicator is the only thing that has been working in the financial markets for quite a long time among other technical analysis indicators.
Woodies CCI indicator is a modification of CCI (Commodity Channel Index). The indicator consists of two CCIs with the periods 6 and 14. A fast curve is used to predict the slow one’s movement. Besides a histogram for the slow CCI, which, depending on the conditions, is colored in different colors, was added into Woodies CCI.
indicator’s values oscillate near zero line and do not have an upper and lower bound. The high indicator’s value indicates the “overbought” price at the moment, a low value indicates the “oversold” price. The key levels of the Woodies CCI indicator are + -100, + -200 levels and zero line. We’ll talk about the Woodies CCI strategy in the next article.
This is How Woodie CCI looks like
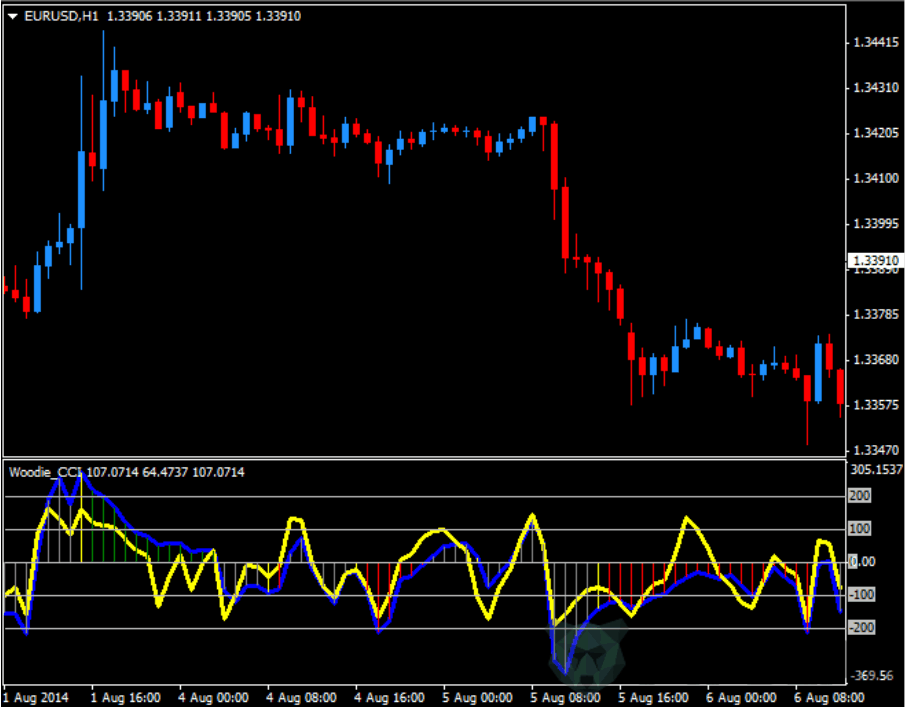
Blueline is slow CCI (14) , yellow is fast CCI(6) .
Formulas for Woodies CCI indicator calculation
I didn’t manage to find the correct formulas, so let’s see the principle of CCI calculation in the open-source code in the thinkorswim terminal.The typical price is The average between high, low, close. Close maybe this index, but in the current indicator the author decided to accept such an index for the asset price. Division into three is not important since the ratio will be calculated at the end.
Linde is the average of the absolute linear deviations of the price from its average over the period = Period.
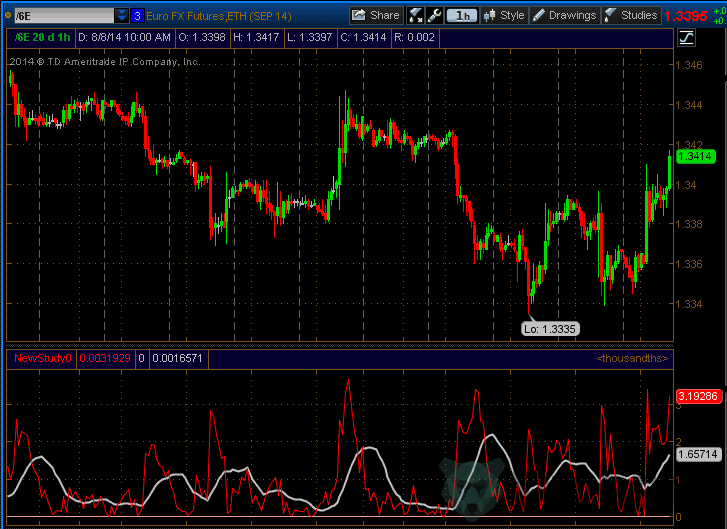
The red line near the indicator is the absolute linear price deviation from its average with a period = period and the white moving is linked or just SMA applied to the red chart with a period = period. The next code’s line determines the CCI indicator’s value.

When having a value line = 0, the indicator’s value is 0, in other cases it is equal to the ratio of absolute deviations of price and linDev multiplied by 0.015. The figure in the denominator is determined by the author to have such absolute values of the indicator as they are, this figure doesn’t affect the indicator’s values relativity.
Woodies CCI indicator consists of two CCI (fast and slow) and a slow CCI histogram which changes its colors, as was previously mentioned. Let’s see the principle the colors are changing by.
Woodies CCI histogram can have four colors: red, green, gray and yellow. When a slow CCI crosses zero line, the histogram changes its color into gray for 4 bars from the moment of crossing the line. If CCI doesn’t cross zero line anymore, the 5th bar of the histogram will have a yellow color and starting from the sixth and onwards the bars will have red color (CCI below the zero line) or green (CCI above the zero line).

Woodies CCI indicator’s parameters
Indicators have only two parameters:
CCI Period is the period of a slow CCI; TCCI Period is the period of fast CCI; The author recommends the 14 and 6 values for hours timeframe. That’s all. We’ll discuss popular Woodies CCI strategy in the next article.
Original Source
Download WOODIES CCI INDICATOR
Installation
Copy and paste the all-woodies-cci.ex4 into the MQL4 indicators folder of the Metatrader 4 trading platform.
You can access this folder from the top menu as follows:
File > Open Data Folder > MQL4 > Indicators (paste here)