How the pro’s trade using the CCI trading system
is very easy to understand. In this article, you will also learn about
the CCI indicator and why it is useful in your trading. If you want to
break from the crowd mentality and join the professional traders then
what you’re about to learn next will grab your interest. Long-term
profitability demands different types of trading skills.
But how we determine the dominant energy of the market?
Moving
forward, we’re going to talk about the CCI indicator also known as the
Commodity Channel Index; we’ll explain the theory behind CCI, and then
highlight some real trade examples to show you how the CCI works.
What is the Commodity Channel Indicator (CCI) indicator?
As you may guess by now, the only indicator you need to spot new market cycles is the CCI indicator.
The
CCI indicator was created by Donald Lambert and was initially used to
identify cycles in the commodity market. However, it tends to perform
the same in the stock market or the Forex currency market and even the
cryptocurrency market for that matter.
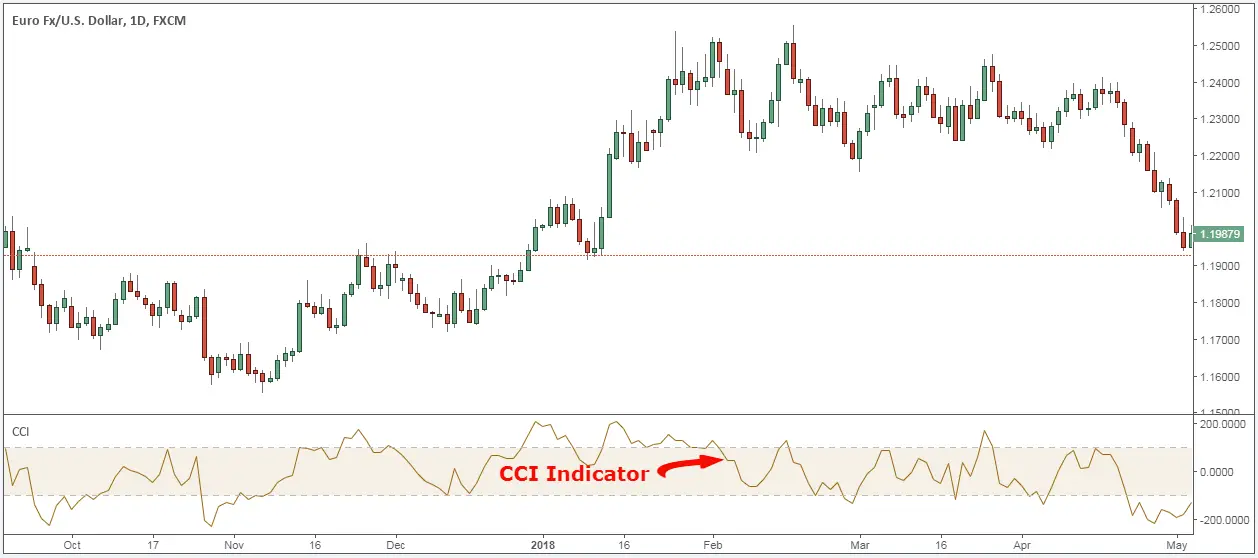
The CCI indicator strategy
was really designed to find cyclical trends in the market and to be
used as a bearish or bullish filter. The CCI is simply an oscillator
indicator that moves the majority of the time between +100 and -100.
Technically,
the way to interpret the Commodity Channel indicator is that a positive
reading above +100 is a bullish signal and a start of an uptrend, while
a negative reading below -100 is a bearish signal.

You
have to keep in mind that technical indicators are just mathematical
equations. However, the CCI is a leading indicator which means it
doesn’t lag behind the price
A good trading tip on how to use the
CCI indicator is in conjunction with chart analysis
How the Professional Traders use the CCI Indicator Strategy
Now, before we go any further, we always recommend
taking a piece of paper and a pen and note down the rules of this entry
method. For this article, we’re going to look at the buy side.
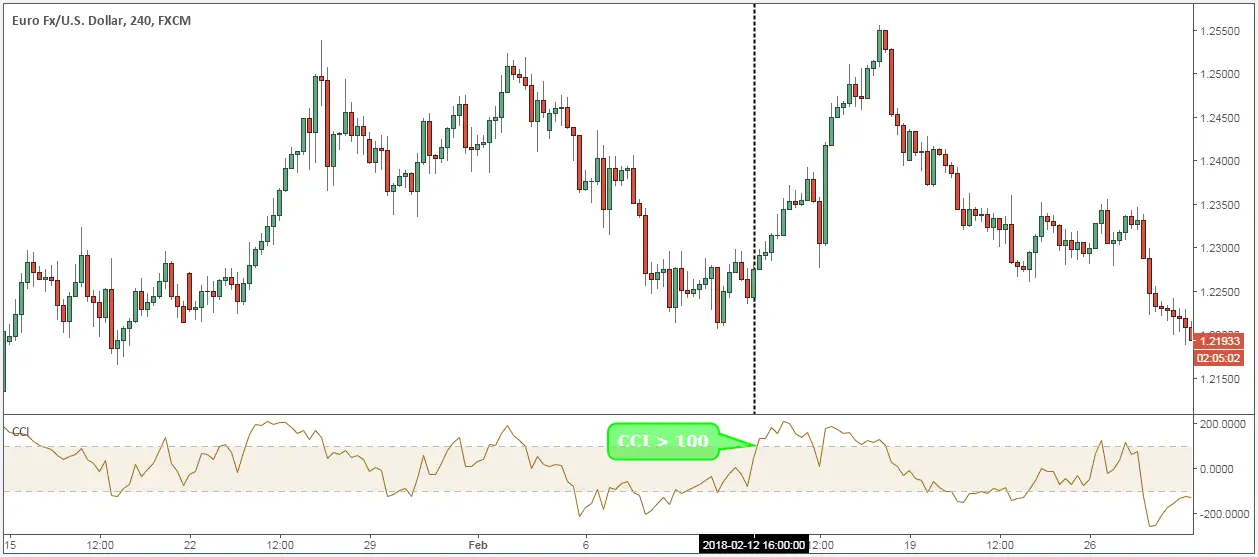
Step #1: Wait until the CCI indicator crosses above +100 level
As a leading indicator, the Commodity Channel indicator can provide us with excellent great trade signals.
When
the CCI crosses for the first time above the +100 level that’s the
signal that a new bullish trend is about to start or at least a rally
will emerge from where you can extract sound profits.
We’re still not ready to trade yet.
There is one more trading condition that needs to be satisfied before pulling the trigger.
See below:
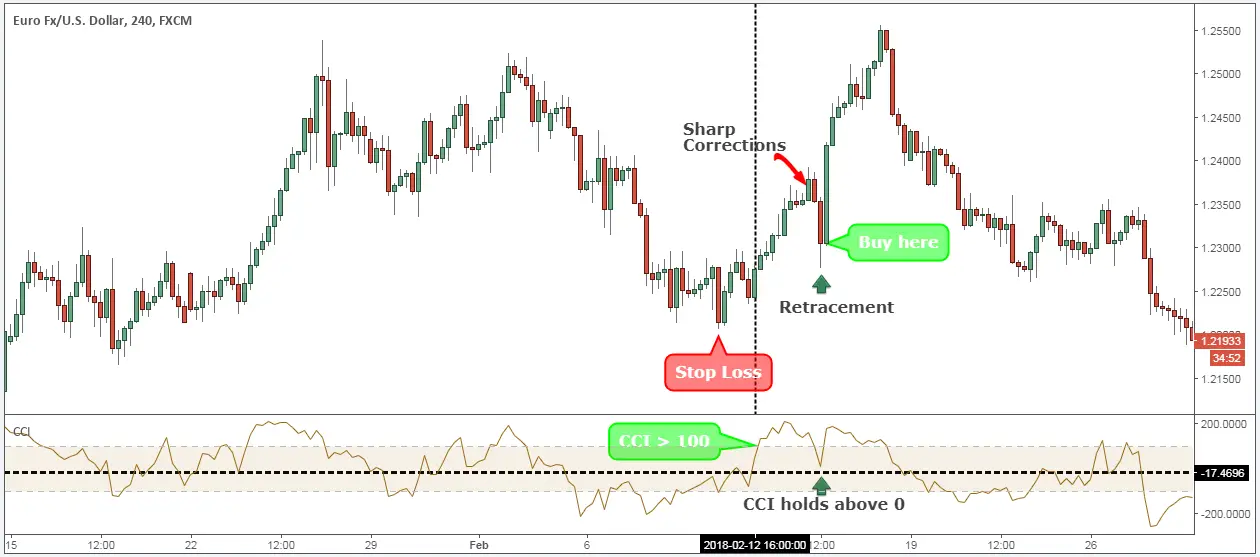
Step #2: Wait for a retracement and make sure that during that retracement the CCI indicator holds above the zero line.
We’re going to apply the more
conservative approach and wait for a retracement and the CCI indicator
to hold above the zero line during this retracement.
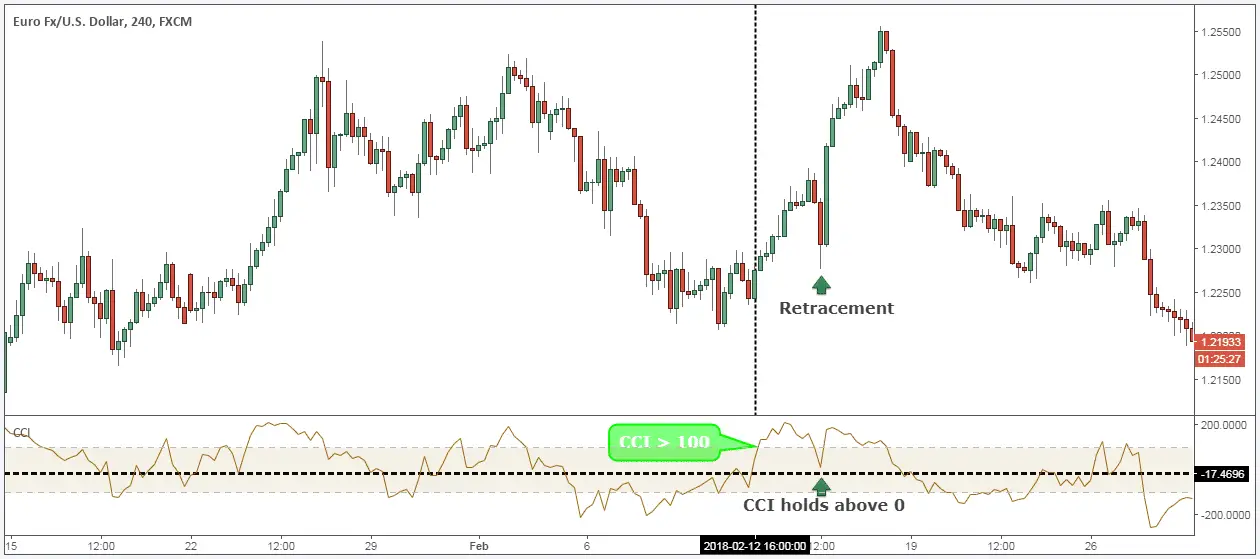
Here is the key.
We
want to see a weak retrace in the CCI indicator that barely goes below
the +100 level, but at the same time, we need to look at the price
action retracing more than the CCI did.
We want to have strength
to the upside if we’re going to buy EUR/USD and we want to see continued
strength in the CCI reading when the price is pulling back.
When
the retracement happens, it’s important for the CCI indicator to remain
above the zero line. If the CCI crosses below the zero line during the
retracement, we’re no longer interested in going long EUR/USD.
Note* The less the CCI turns down, the more powerful the rally should be.
The next step will highlight the trigger for our entry order.
See below:
Step #3: Buy after 3 or 5 candles “worth” of retracement. Or, sharp Corrections are bought at the closing price.
We have two options for our entry strategy.
We
either buy after we have seen the market pulling back over the last 3-5
candles or we buy straight away if we have sharp corrections.
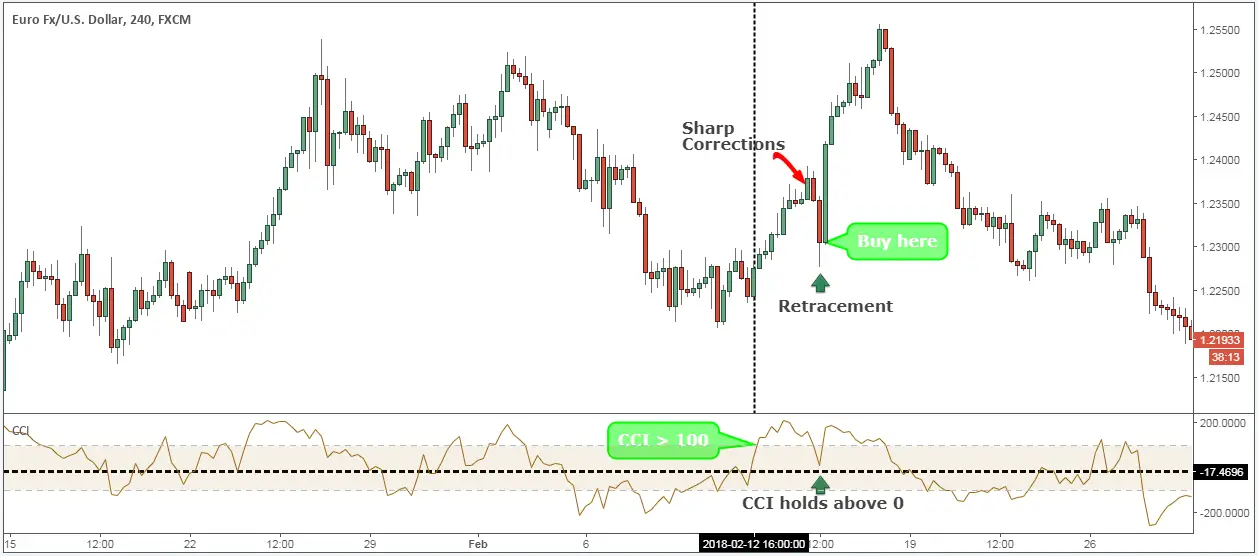
The natural ebb and flow of the market are given by these short-term pullbacks that we’re going to use to trigger our entry.
If
the retrace was weak, it means the dominant energy of the market
remains up. The CCI indicator strategy reflects quite well what is
happening behind the scene where the actual buying and selling pressure
takes place.This brings us to the next important thing that we need to establish for the CCI trading strategy, which is where to place our protective stop loss.
See below
Step #4: Place your protective Stop Loss below the most recent swing low
However,
it’s important to also watch the CCI indicator for further clues of
weakness, and if the CCI crosses below the -100 level after you’ve
entered the market, you can close the trade at the market price if your
stop loss wasn’t triggered in the process.
Last but not least, we also need to define where we take profits when trading with the Commodity Channel Index indicator.
See below:
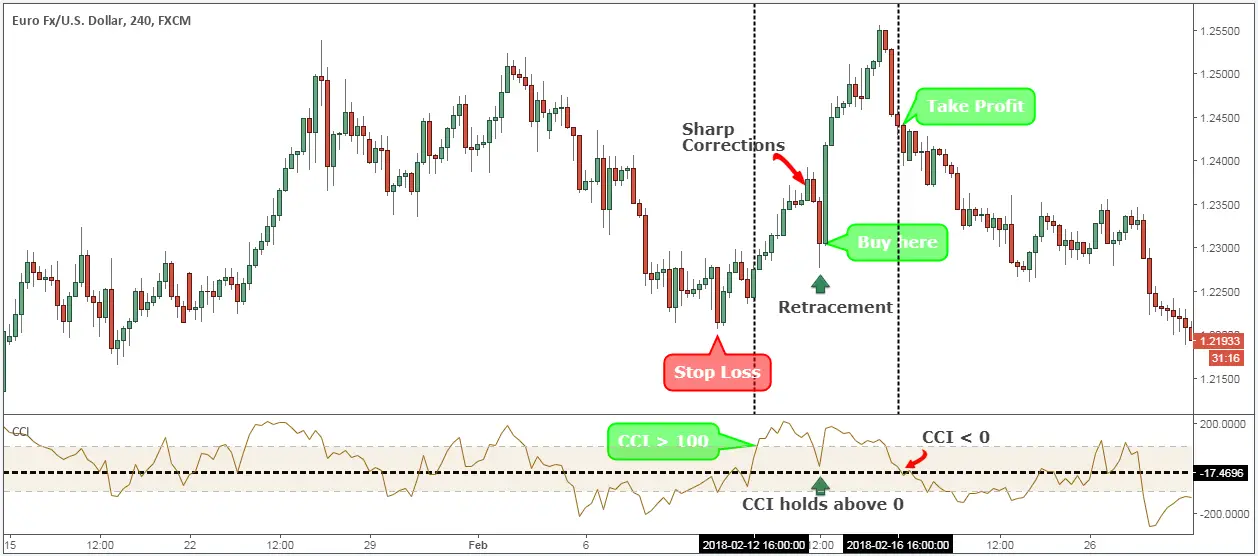
Step #5: Take profit if CCI touches 200 or if CCI drops below the zero level. Whichever happens first.
The more profitable exit strategy is to take profits when the CCI touches the +200 level. However, since the market will only occasionally give us such big trading opportunities we need to have a backup plan.
So….
As
soon as the CCI indicator turns below the zero level, we want to exit
our trade. The first sign that the rally is running out of steam is when
the CCI indicator crosses below the zero line.
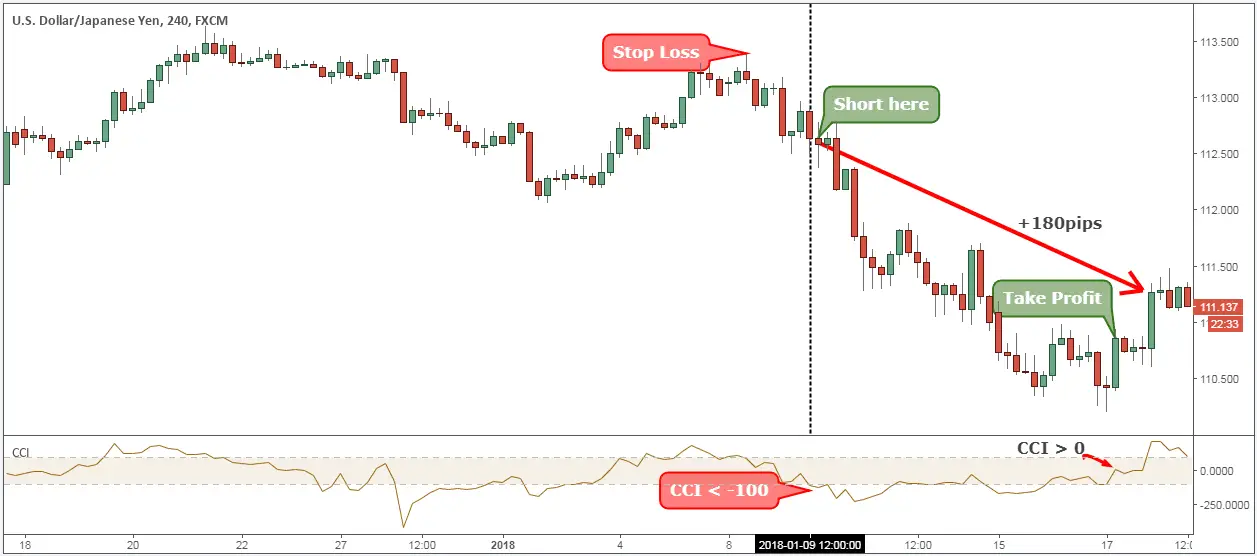
Note**
the above was an example of a BUY trade using our CCI trading strategy
PDF. Use the same rules for a SELL trade – but in reverse. In the figure
below, you can see an actual SELL trade example.
Conclusion – CCI Indicator Strategy
If you got value from the CCI trading strategy PDF, please don’t be shy to share it with others. It feels good to do the right thing, so go ahead and do the right thing and you’ll have your heart filled with joy.
ORIGINAL SOURCE